Performance of Derivative Works in Series
Performance of Derivative Works in Series
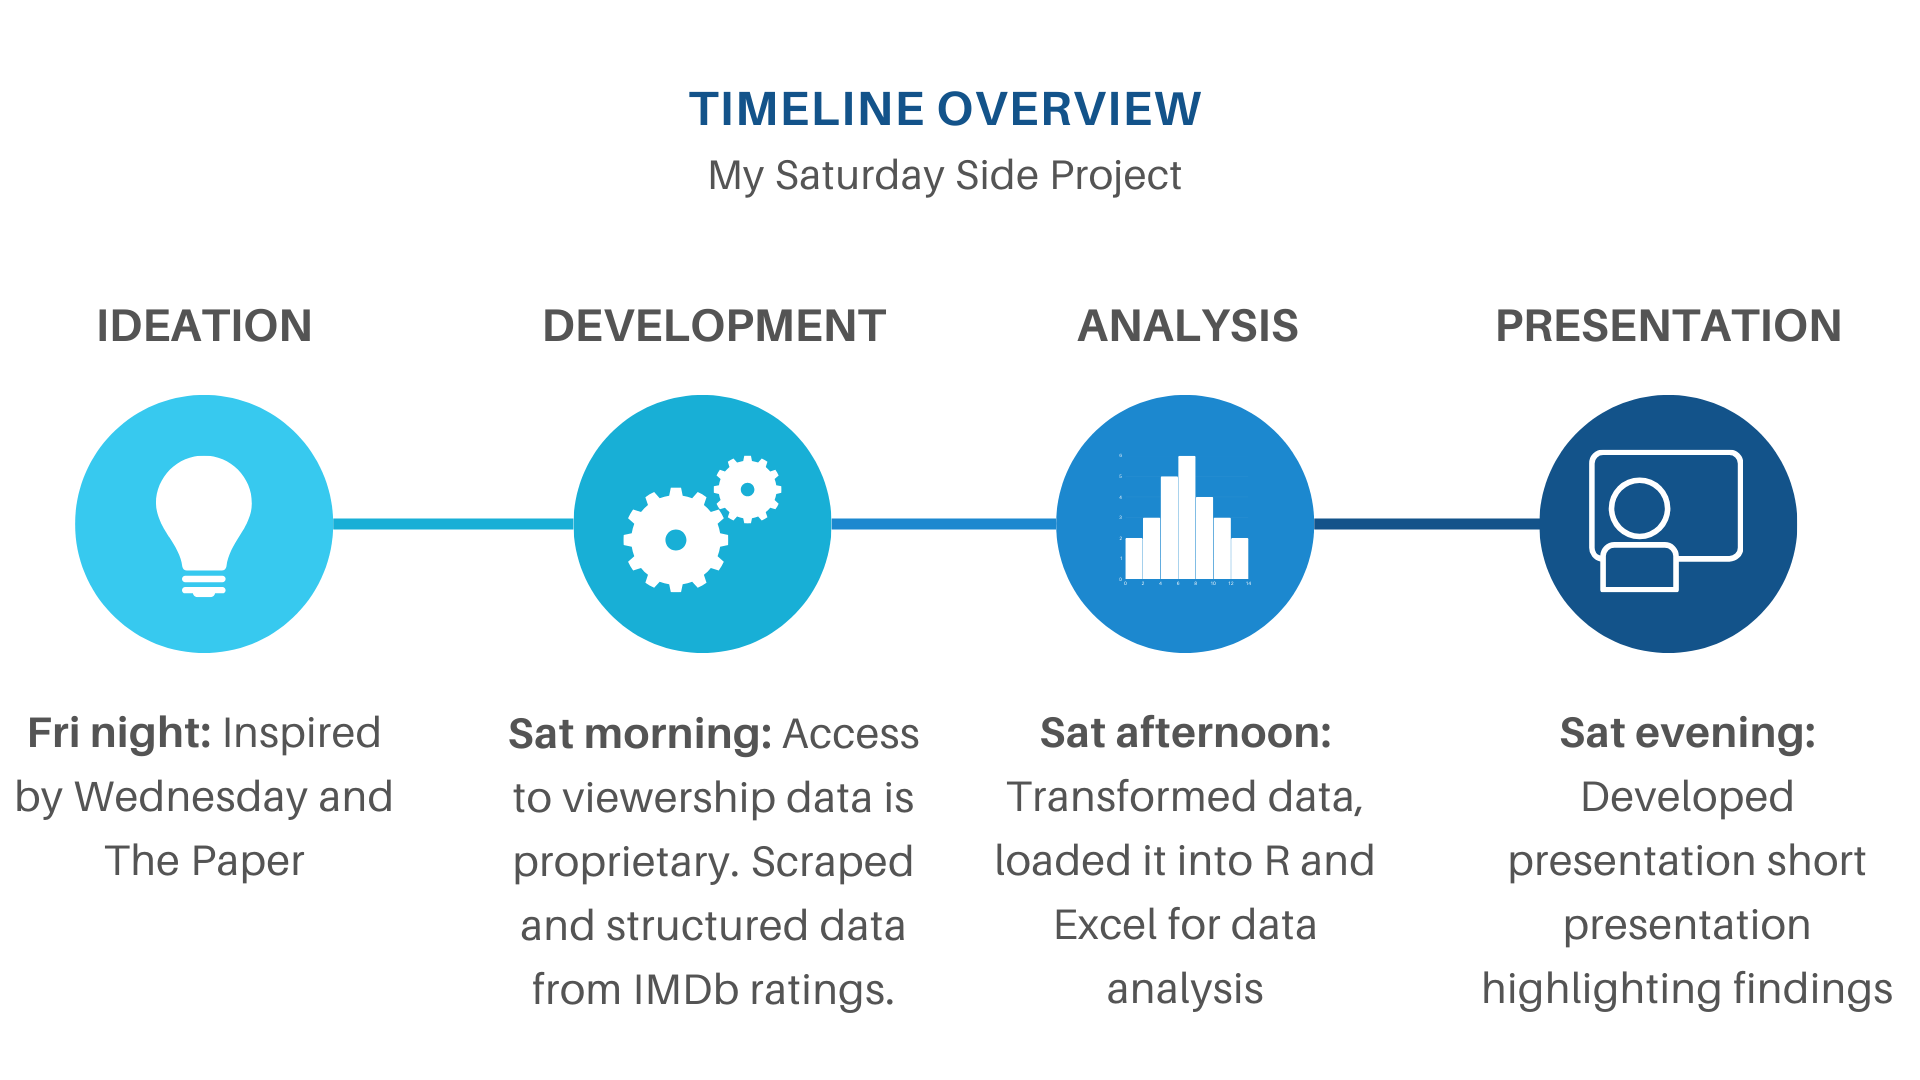
Context: On Friday night, I watched Wednesday and then the Paper with my girlfriend. We had a conversation about how each one came from a different source material but were compelling in their own right. This gave me an idea for this side project, where I compare the performance of different derivative works in series that I personally have watched. I hope you enjoy this Saturday side project as much as I did making it.
Below, you'll find the slide deck. Please, reach out if you'd like a walk through of the presentation. Code for this project is available via GitHub upon request.
This slide deck is a bit light on the statistics. If you'd like to see more on my statistical abilities, check out my UCLA MS Statistics projects list.
If you'd like to see more business oriented project work, check out these two projects:
Your Medical Group is Losing Millions - The hidden financial drain in medical practices that's costing millions in lost revenue and operational inefficiency.
Data Science Can Improve Middle Management Effectiveness - Data science can improve middle management effectiveness as organizations scale.